• Contact Us
  • Privacy Policy
  • Terms of Use
  • DMCA
  • Disclaimer
Monday, May 20, 2024
CryptoBangs.com
Advertisement
  • Home
  • Live Crypto Prices
  • Crypto News
    • Bitcoin
    • Ethereum
    • Ripple
    • Altcoin
    • NFT News
  • DeFi
  • Blockchain
  • Regulation
  • Shop
  • Blog
  • Calculator
No Result
View All Result
  • Home
  • Live Crypto Prices
  • Crypto News
    • Bitcoin
    • Ethereum
    • Ripple
    • Altcoin
    • NFT News
  • DeFi
  • Blockchain
  • Regulation
  • Shop
  • Blog
  • Calculator
No Result
View All Result
CryptoBangs.com
No Result
View All Result

This Major BTC Metric Just Turned Bullish Once Again

May 20, 2024
in Bitcoin
Reading Time: 3 mins read
A A
This Major BTC Metric Just Turned Bullish Once Again
ShareShareShareShareShare

Related articles

Gold Prices Break Record Highs, Silver Also Rallies

Gold Prices Break Record Highs, Silver Also Rallies

May 20, 2024
Crypto Institutions Gobble Up Billions In Bitcoin ETFs, Stockpiling 250,000 BTC

Crypto Institutions Gobble Up Billions In Bitcoin ETFs, Stockpiling 250,000 BTC

May 19, 2024

A crucial Bitcoin metric has just turned bullish, sparking optimism from a crypto analyst regarding an impending rally for Bitcoin. This unique technical pattern suggests that the world’s largest cryptocurrency could see its price ascending further, potentially kick-starting a highly welcomed bull run this cycle. 

Bitcoin Technical Pattern Flips Bullish

Bitcoin’s price has often followed distinct historical patterns, with the majority of these indicators preceding significant rallies or bearish trends. One of the most compelling signs that Bitcoin may be turning bullish again is seen as the Stablecoin Supply Ratio (SSR) Oscillator breaks below the lower Bollinger Bands, a technical indicator used to measure a market’s volatility and momentum. 

Related Reading

According to a crypto analyst identified as ‘Dominando Cripto’ on X (formerly Twitter), the SSR is a unique technical tool designed to evaluate the market sentiment by comparing the supply of stablecoins to Bitcoin. This tool is used by analysts and traders to identify buying and selling opportunities for Bitcoin. Additionally, it quantifies how the 200-day Simple Moving Average (SMA) of the SSR moves within the Bollinger Bands. 

Source: X

Dominando Cripto has provided an in-depth explanation of how the SSR oscillator is calculated and how to interpret its signals for identifying bullish trends. 

“The oscillator is calculated by taking the difference between the current Stablecoin Supply Ratio value and its 200-day Simple Moving Average (SMA), then dividing it by the standard deviation of the SSR over the same period,” the analyst stated. 

Sharing a price chart depicting movements of the SSR oscillator, the crypto analyst suggests that when the oscillator moves above the upper Bollinger Bands, it suggests that the SSR is significantly higher than normal levels. This indicates that stablecoins are dominating the market, signaling bearish sentiment and a potential downturn for Bitcoin. 

Conversely, when the oscillator falls below the lower Bollinger Band, it indicates that the SSR is low, highlighting the reduced dominance of stablecoins and signaling bullish sentiment that could potentially trigger an incoming rally in Bitcoin. 

In the above price chart, Dominando Crypto pinpointed several instances when the SSR oscillator displayed bearish and bullish sentiment, identifying these periods as heated zones and cold zones, respectively. Recent market movements indicate that the SSR oscillator is in the cold zone, indicating a potential bullish outlook for Bitcoin. 

More Bullish Signs For BTC

On May 18, Blockchain analytics platform, Santiment, revealed a new market trend where small traders are consistently liquidating their BTC holdings, even as the cryptocurrency has shown positive performance lately. 

Related Reading

The analytics platform noted that historically, when small wallets dump coins into larger wallets, it is considered an encouraging sign for Bitcoin, indicating a potential bullish turnaround for the pioneer cryptocurrency. 

At the time of writing, Bitcoin’s price is trading at $66,955, according to CoinMarketCap. The cryptocurrency has been on a major bullish momentum recently, witnessing an 8.94% increase in the last seven days and a 4.25% surge over the past month. 

Bitcoin price chart from Tradingview.com
BTC price recovers above $67,000 | Source: BTCUSD on Tradingview.com

Featured image created using Dall.E, chart from Tradingview.com

Credit: Source link

ShareTweetSendPinShare
Previous Post

Price Expected to Surge by +400% This Week!

Next Post

Web3 gaming investments surge to nearly $1 billion in April 2024

Related Posts

Gold Prices Break Record Highs, Silver Also Rallies

Gold Prices Break Record Highs, Silver Also Rallies

May 20, 2024

Gold has continued rising in financial markets, hitting new all-time high (ATH) prices against the U.S. dollar. The precious metal’s...

Crypto Institutions Gobble Up Billions In Bitcoin ETFs, Stockpiling 250,000 BTC

Crypto Institutions Gobble Up Billions In Bitcoin ETFs, Stockpiling 250,000 BTC

May 19, 2024

The tides are turning in the cryptocurrency world, with institutional investors making a big splash in Bitcoin exchange-traded funds (ETFs)...

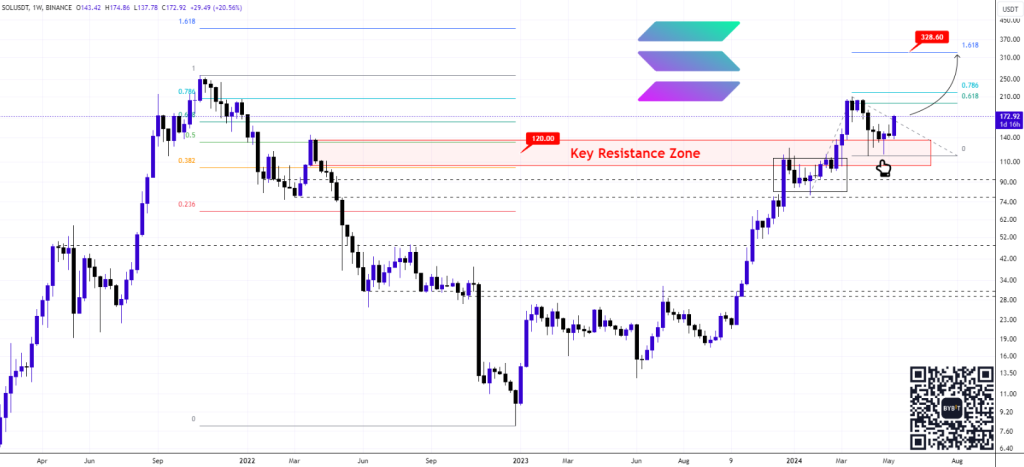
Solana Blasts Past Resistance: Buckle Up for $330

Solana Blasts Past Resistance: Buckle Up for $330

May 19, 2024

Solana (SOL) is riding a wave of investor confidence, with its price steadily climbing towards uncharted territory. This bullish trend...

Vitalik Buterin Outlines Improvements for Ethereum’s Decentralized Future

Vitalik Buterin Outlines Improvements for Ethereum’s Decentralized Future

May 19, 2024

Ethereum co-founder Vitalik Buterin has proposed several enhancements aimed at improving the network’s permissionlessness and decentralization. The proposed changes focus...

Stop Betting on Dead Horses!

Stop Betting on Dead Horses!

May 19, 2024

The world of finance is no stranger to colorful characters, and this week, the gloves came off between two titans...

Load More
Next Post
Web3 gaming investments surge to nearly $1 billion in April 2024

Web3 gaming investments surge to nearly $1 billion in April 2024

Leave a Reply Cancel reply

Your email address will not be published. Required fields are marked *

ChatGPT Predicts When SHIB Could Hit ATH

ChatGPT Predicts When SHIB Could Hit ATH

May 14, 2024
Ripple Holds Strong in Launching Channel; Analyst Predicts XRP Target

Ripple Holds Strong in Launching Channel; Analyst Predicts XRP Target

May 14, 2024
Could This Multi-Chain Crypto Presale Explode 100x at Launch?

Could This Multi-Chain Crypto Presale Explode 100x at Launch?

May 18, 2024
Dogwifhat (WIF) And BOOK OF MEME (BOME) Memecoins Plunge Despite Bullish Influence! What’s Next?

Dogwifhat (WIF) And BOOK OF MEME (BOME) Memecoins Plunge Despite Bullish Influence! What’s Next?

May 17, 2024
Rollblock (RBLK) vs. Tron (TRX) and Polkadot (DOT): Which Crypto Offers Better Returns?

Rollblock (RBLK) vs. Tron (TRX) and Polkadot (DOT): Which Crypto Offers Better Returns?

May 18, 2024
CryptoBangs.com

CryptoBangs.com is an online news portal that aims to share the latest crypto news, bitcoin, altcoin, blockchain, nft news and much more stuff like that.

What’s New Here!

  • Web3 gaming investments surge to nearly $1 billion in April 2024
  • This Major BTC Metric Just Turned Bullish Once Again
  • Price Expected to Surge by +400% This Week!
  • Gold Prices Break Record Highs, Silver Also Rallies

Newsletter

Don't miss a beat and stay up to date with our Newsletter!
Loading

  • Contact Us
  • Privacy Policy
  • Terms of Use
  • DMCA
  • Disclaimer

© 2023 - CryptoBangs.com - All Rights Reserved!

No Result
View All Result
  • Home
  • Live Crypto Prices
  • Crypto News
    • Bitcoin
    • Ethereum
    • Ripple
    • Altcoin
    • NFT News
  • DeFi
  • Blockchain
  • Regulation
  • Shop
  • Blog
  • Calculator

© 2018 JNews by Jegtheme.

You have not selected any currencies to display
WP Twitter Auto Publish Powered By : XYZScripts.com