• Contact Us
  • Privacy Policy
  • Terms of Use
  • DMCA
  • Disclaimer
Thursday, December 18, 2025
CryptoBangs.com
Advertisement
  • Home
  • Live Crypto Prices
  • Crypto News
    • Bitcoin
    • Ethereum
    • Ripple
    • Altcoin
    • NFT News
  • DeFi
  • Blockchain
  • Regulation
  • Shop
  • Blog
  • Calculator
No Result
View All Result
  • Home
  • Live Crypto Prices
  • Crypto News
    • Bitcoin
    • Ethereum
    • Ripple
    • Altcoin
    • NFT News
  • DeFi
  • Blockchain
  • Regulation
  • Shop
  • Blog
  • Calculator
No Result
View All Result
CryptoBangs.com
No Result
View All Result

Bitcoin Price Action: What to Expect Next

September 13, 2024
in Bitcoin
Reading Time: 2 mins read
A A
Bitcoin Price Action: What to Expect Next
ShareShareShareShareShare

Bitcoin’s recent price movements have caused concern among investors about what might come next. However, by looking at key indicators such as the 200-week moving average, Pi Cycle Top Indicator, and the Golden Ratio Multiplier, we can gain insights into potential support and resistance levels for Bitcoin.

Leaning Bearish?

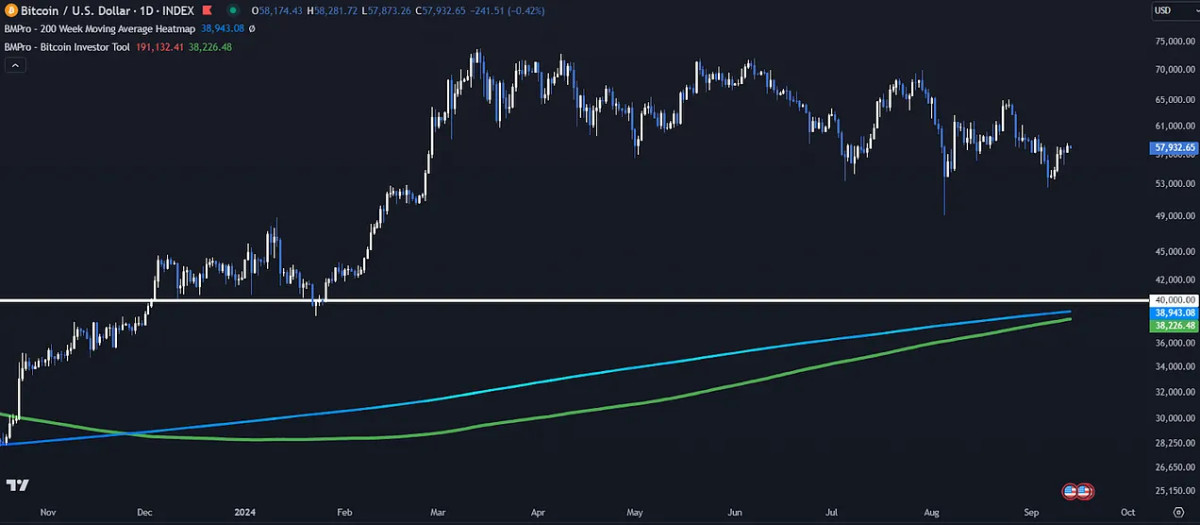
In recent weeks, Bitcoin’s price has fluctuated, dipping as low as $53,000 before stabilizing in the middle of our newly formed $50,000 to $60,000 range. If this bearish price action is to continue and price breaks to lower lows the 200-week moving average heatmap (blue line), a historically critical support level, is currently close to $39,000 but fast approaching $40,000 (white line). This round psychological level also aligns with the Bitcoin Investor Tool (green line), which has also converged with the 200-week moving average, could serve as potential downside targets.

Figure 1: Converging levels of support at $40,000 if bearish price action continues.

Nearby Targets

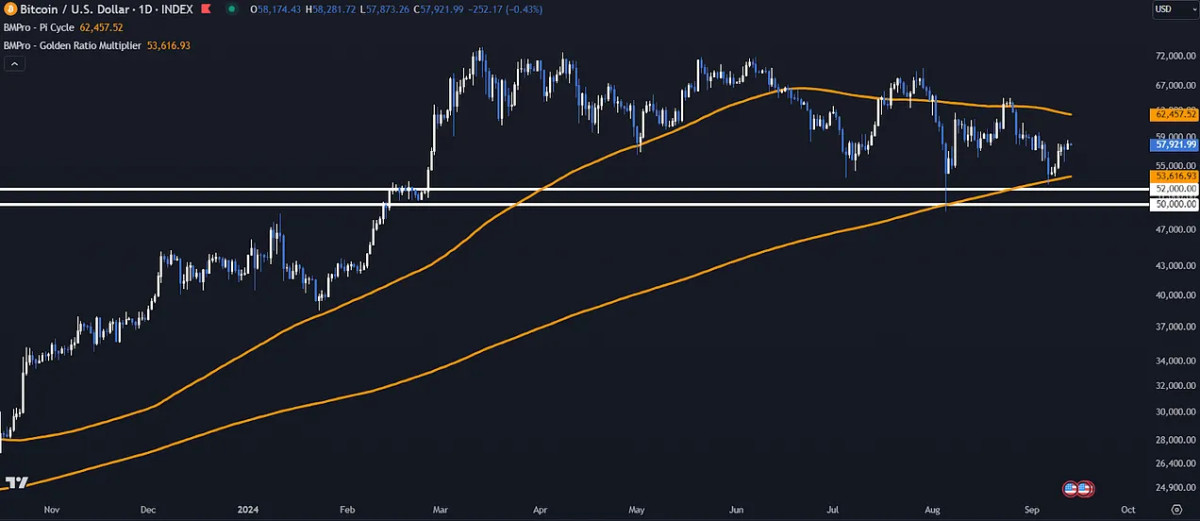
Above current price there are several important levels closer to the current price that investors need to keep an eye on. The Pi Cycle Top Indicator (upper orange line) suggests a crucial resistance level around $62,000, based on the 111-day moving average. The Golden Ratio Multiplier (lower orange line) indicates that the 350-day moving average, currently around $53,000, has been a solid level of support during this market cycle, especially as this is close to the technical $52,000 support and significant psychological support of $50,000.

Figure 2: Nearby support between $53,000 and $50,000, with immediate resistance between $60,000 and $62,000.

More Chop?

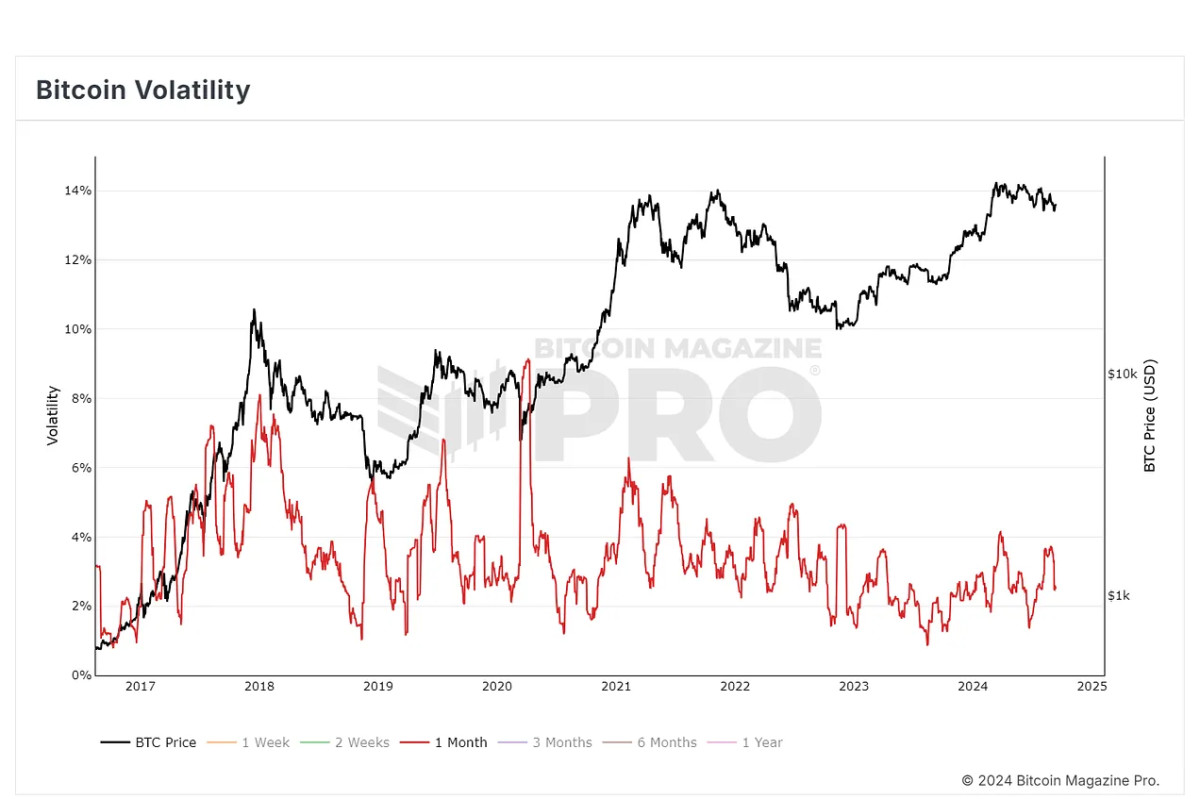
In the short term, Bitcoin could very well continue ranging between the low $50,000 region and the $60,000 resistance, similar to the range we had formed between $70,000 and $60,000 that led to fairly stagnant price action for a majority of 2024. Despite recent downturns, Bitcoin’s long-term outlook is still promising. In the past, Bitcoin has experienced similar periods of fluctuating prices before eventually reaching new highs. However, this process can take some time, potentially weeks or even months, before a sustainable trend reversal occurs following periods of low volatility.

Figure 3: Monthly volatility is rapidly decreasing, potentially as BTC finds a new range between $50,000 and $60,000. View Live Chart

Conclusion

For long-term investors, it’s important to remain calm and not be swayed by day-to-day price changes. Over-trading often leads to poor decisions and losses, and the key is to stick to a strategy, whether it involves accumulating at support levels or taking profits at resistance.

Related articles

Tucker Carlson and Roger Ver Reveal Shocking Details About US Extradition Battle and Bitcoin in Exclusive TCN Interview

Tucker Carlson and Roger Ver Reveal Shocking Details About US Extradition Battle and Bitcoin in Exclusive TCN Interview

December 10, 2024
Former US Treasury Secretary Calls Trump’s National Bitcoin Reserve Proposal ‘Crazy’

Former US Treasury Secretary Calls Trump’s National Bitcoin Reserve Proposal ‘Crazy’

December 10, 2024

Bitcoin’s recent price action has not been ideal, but with some simple technical analysis and a clear understanding of support and resistance levels, investors can prepare and react rather than over overreact to natural market fluctuations.

For a more in-depth look into this topic, check out our recent YouTube video here: Bitcoin Price Action: What to Expect Next

Credit: Source link

ShareTweetSendPinShare
Previous Post

Ethereum in Trouble; $258M ETH Dumped Amid ETF Outflow

Next Post

SOL Stalls at $137 Weekly High Amid Bearish Trends; Is a Breakout Next?

Related Posts

Tucker Carlson and Roger Ver Reveal Shocking Details About US Extradition Battle and Bitcoin in Exclusive TCN Interview

Tucker Carlson and Roger Ver Reveal Shocking Details About US Extradition Battle and Bitcoin in Exclusive TCN Interview

December 10, 2024

In a recent interview on the Tucker Carlson Network, Tucker Carlson explored Roger Ver’s perspective on his ongoing legal battle...

Former US Treasury Secretary Calls Trump’s National Bitcoin Reserve Proposal ‘Crazy’

Former US Treasury Secretary Calls Trump’s National Bitcoin Reserve Proposal ‘Crazy’

December 10, 2024

President-elect Donald Trump’s proposal to establish a national Bitcoin reserve has ignited a wave of criticism from economic experts, including...

Almost $10 Billion Invested In US Bitcoin ETFs

Almost $10 Billion Invested In US Bitcoin ETFs

December 10, 2024

Este artículo también está disponible en español. Since Donald Trump became president-elect a little more than a month ago, roughly...

BRICS Retaliation Ahead? Expert Predicts US Tariff Fallout

BRICS Retaliation Ahead? Expert Predicts US Tariff Fallout

December 10, 2024

BRICS nations brace for a global economic standoff as U.S. tariff threats spark concerns about trade retaliation and geopolitical tensions,...

Crypto Fund Flows Hit $3.85 Billion Weekly Record As Bitcoin And Ethereum Dominate

Crypto Fund Flows Hit $3.85 Billion Weekly Record As Bitcoin And Ethereum Dominate

December 9, 2024

According to the latest report by CoinShares, crypto asset investment products have achieved a historic milestone, with weekly inflows totaling...

Load More
Next Post
SOL Stalls at $137 Weekly High Amid Bearish Trends; Is a Breakout Next?

SOL Stalls at $137 Weekly High Amid Bearish Trends; Is a Breakout Next?

No Content Available
CryptoBangs.com

CryptoBangs.com is an online news portal that aims to share the latest crypto news, bitcoin, altcoin, blockchain, nft news and much more stuff like that.

What’s New Here!

  • Tucker Carlson and Roger Ver Reveal Shocking Details About US Extradition Battle and Bitcoin in Exclusive TCN Interview
  • Goldman Sachs eyeing crypto market-making for Bitcoin, Ethereum if US regulations shift
  • BC.GAME Announces UFC Welterweight Champion Colby Covington as New Brand Ambassador
  • How High Will Dogecoin Rise If the Markets ‘Go Wild’?

Newsletter

Don't miss a beat and stay up to date with our Newsletter!
Loading

  • Contact Us
  • Privacy Policy
  • Terms of Use
  • DMCA
  • Disclaimer

© 2023 - CryptoBangs.com - All Rights Reserved!

No Result
View All Result
  • Home
  • Live Crypto Prices
  • Crypto News
    • Bitcoin
    • Ethereum
    • Ripple
    • Altcoin
    • NFT News
  • DeFi
  • Blockchain
  • Regulation
  • Shop
  • Blog
  • Calculator

© 2018 JNews by Jegtheme.

Please enter CoinGecko Free Api Key to get this plugin works.
WP Twitter Auto Publish Powered By : XYZScripts.com