• Contact Us
  • Privacy Policy
  • Terms of Use
  • DMCA
  • Disclaimer
Monday, August 12, 2024
CryptoBangs.com
Advertisement
  • Home
  • Live Crypto Prices
  • Crypto News
    • Bitcoin
    • Ethereum
    • Ripple
    • Altcoin
    • NFT News
  • DeFi
  • Blockchain
  • Regulation
  • Shop
  • Blog
  • Calculator
No Result
View All Result
  • Home
  • Live Crypto Prices
  • Crypto News
    • Bitcoin
    • Ethereum
    • Ripple
    • Altcoin
    • NFT News
  • DeFi
  • Blockchain
  • Regulation
  • Shop
  • Blog
  • Calculator
No Result
View All Result
CryptoBangs.com
No Result
View All Result

Bitcoin Investors Again Show Extreme Fear As BTC Slips To $59,000

August 12, 2024
in Bitcoin
Reading Time: 3 mins read
A A
Bitcoin Investors Again Show Extreme Fear As BTC Slips To $59,000
ShareShareShareShareShare

Related articles

PEPU Presale Raises $8M for New Ethereum-Beating Layer-2 Solution

PEPU Presale Raises $8M for New Ethereum-Beating Layer-2 Solution

August 12, 2024
Altcoins Facing Severe Losses, But Experts Suggest A Potential Upswing

Altcoins Facing Severe Losses, But Experts Suggest A Potential Upswing

August 12, 2024

Data shows the Bitcoin market sentiment has taken to extreme fear again as the asset’s price has seen a retrace to the $59,000 mark.

Bitcoin Fear & Greed Index Suggests Market Now Extremely Fearful

The “Fear & Greed Index” is an indicator created by Alternative that tells us about the average sentiment that’s currently present in the Bitcoin and wider cryptocurrency markets.

The index uses the following five factors to determine the sentiment: volatility, trading volume, social media sentiment, market cap dominance, and Google Trends. It then represents this estimation using a scale that runs from 0-100

Related Reading

All values of the indicator beyond the 53 mark imply that investors are showing greed, while those below 47 suggest the presence of fear in the market. The region between these two cutoffs naturally corresponds to a neutral mentality.

Besides these three territories, there are also two special sentiments called the extreme fear and the extreme greed. The former of these occurs at 25 and below, while the latter at 75 and above.

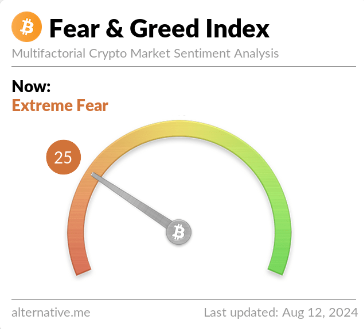
Now, here is what the latest value of the Bitcoin Fear & Greed Index looks like:

The value of the index appears to be 25 | Source: Alternative

As is visible above, the indicator has a value of 25 at the moment, meaning that the market is just inside the extreme fear zone. This is a pretty significant change from how the metric was just yesterday.

The below chart shows the trend in the Bitcoin Fear & Greed Index over the past month.

Bitcoin Fear & Greed Index
Looks like the value of the indicator has gone down recently | Source: Alternative

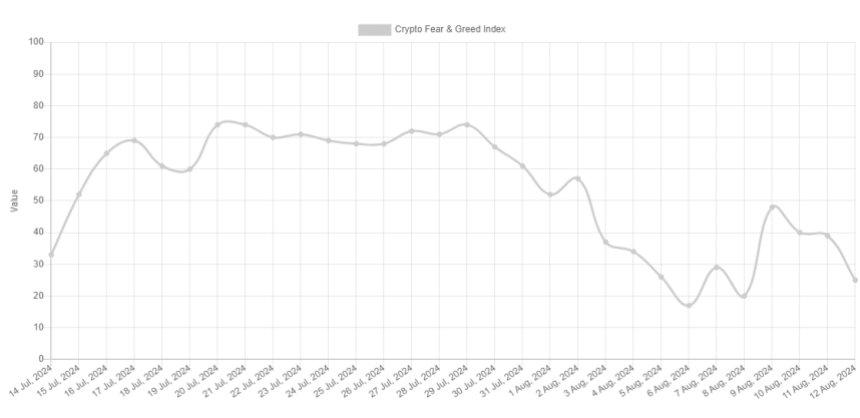
From the graph, it’s apparent that the Fear & Greed Index had been at a high level near the end of July, but during the bearish momentum that had followed in the BTC price, the metric’s value had also gone through a notable drop.

On the 29th, the index was at a value of 74, meaning it was right on the edge of extreme greed, but by the 6th of this month, it had gone into the extreme fear zone with a value of 17.

The asset’s recent recovery did lead to an improvement to the sentiment, with the index traveling back up to 48. It would appear, though, that this growth couldn’t last, as the sentiment has again declined into extreme fear, as the BTC price has seen a retrace.

Related Reading

The fact that the sentiment has worsened, however, may not actually be a bad sign for the cryptocurrency. Historically, Bitcoin has tended to move against the expectations of the majority, and the extreme regions are where this expectation is perhaps the strongest.

As such, tops and bottoms have tended to form whenever the market has been inside these zones. With the Fear & Greed Index now back inside extreme fear, It’s possible that a bottom could be likely to take place. It now remains to be seen if the asset’s decline ends with this drop, or if there is more to come.

BTC Price

Bitcoin appears to already be showing signs of a rebound as its price has climbed back up to $59,700 from its low of under $58,000 earlier in the day.

Bitcoin Price Chart
The price of the coin seems to have gone through a decline over the past day or so | Source: BTCUSD on TradingView

Featured image from Dall-E, Alternative.me, chart from TradingView.com

Credit: Source link

ShareTweetSendPinShare
Previous Post

Will SHIB Boom Or Tank?

Next Post

Bullish Pattern Spotted in Ethereum, Eyes on 12% Price Jump

Related Posts

PEPU Presale Raises $8M for New Ethereum-Beating Layer-2 Solution

PEPU Presale Raises $8M for New Ethereum-Beating Layer-2 Solution

August 12, 2024

Pepe Unchained (PEPU), one of the most talked-about new meme coin projects, has just passed $8 million in its presale...

Altcoins Facing Severe Losses, But Experts Suggest A Potential Upswing

Altcoins Facing Severe Losses, But Experts Suggest A Potential Upswing

August 12, 2024

The crypto market is not where it should be right now, at least in terms of prices – altcoins specifically...

Could It Skyrocket To $100? Analysts Share Their Predictions

Could It Skyrocket To $100? Analysts Share Their Predictions

August 11, 2024

Crypto market participants are paying attention to XRP. There has been a continuous bounce between trend lines, forming what analysts...

Bitcoin Slips Below $59K as Crypto Market Faces $132M in Liquidations

Bitcoin Slips Below $59K as Crypto Market Faces $132M in Liquidations

August 11, 2024

On Sunday, bitcoin slipped below the $60,000 mark and dipped even further beneath the $59,000 range. The leading cryptocurrency touched...

Bitcoin Improves Market Dominance Over Altcoins, Stands Firm On Major Support

Bitcoin Improves Market Dominance Over Altcoins, Stands Firm On Major Support

August 11, 2024

Bitcoin experienced a turbulent week marked by significant price fluctuations that kept investors on edge. The cryptocurrency endured a rollercoaster...

Load More
Next Post
Bullish Pattern Spotted in Ethereum, Eyes on 12% Price Jump

Bullish Pattern Spotted in Ethereum, Eyes on 12% Price Jump

Leave a Reply Cancel reply

Your email address will not be published. Required fields are marked *

Solana Gains 40% Post-Crash; Can SOL Retest the $184 Mark?

Solana Gains 40% Post-Crash; Can SOL Retest the $184 Mark?

August 8, 2024
the G.A.M.E.’ to Debut on Arbitrum

the G.A.M.E.’ to Debut on Arbitrum

August 7, 2024
Ethereum price struggles as large holders continue offloading

Ethereum price struggles as large holders continue offloading

August 5, 2024
Bitcoin Investors Again Show Extreme Fear As BTC Slips To $59,000

Bitcoin Investors Again Show Extreme Fear As BTC Slips To $59,000

August 12, 2024
Bitcoin (BTC) and Ripple (XRP) Keep Bleeding while the Ethereum DEXs Stay in the Green, Is AAVE Going Higher?

Bitcoin (BTC) and Ripple (XRP) Keep Bleeding while the Ethereum DEXs Stay in the Green, Is AAVE Going Higher?

August 6, 2024
CryptoBangs.com

CryptoBangs.com is an online news portal that aims to share the latest crypto news, bitcoin, altcoin, blockchain, nft news and much more stuff like that.

What’s New Here!

  • Bullish Pattern Spotted in Ethereum, Eyes on 12% Price Jump
  • Bitcoin Investors Again Show Extreme Fear As BTC Slips To $59,000
  • Will SHIB Boom Or Tank?
  • Gunzilla Games Expand ‘Off the Grid’ Pioneers Program to PlayStation 5

Newsletter

Don't miss a beat and stay up to date with our Newsletter!
Loading

  • Contact Us
  • Privacy Policy
  • Terms of Use
  • DMCA
  • Disclaimer

© 2023 - CryptoBangs.com - All Rights Reserved!

No Result
View All Result
  • Home
  • Live Crypto Prices
  • Crypto News
    • Bitcoin
    • Ethereum
    • Ripple
    • Altcoin
    • NFT News
  • DeFi
  • Blockchain
  • Regulation
  • Shop
  • Blog
  • Calculator

© 2018 JNews by Jegtheme.

You have not selected any currencies to display
WP Twitter Auto Publish Powered By : XYZScripts.com