• Contact Us
  • Privacy Policy
  • Terms of Use
  • DMCA
  • Disclaimer
Thursday, December 18, 2025
CryptoBangs.com
Advertisement
  • Home
  • Live Crypto Prices
  • Crypto News
    • Bitcoin
    • Ethereum
    • Ripple
    • Altcoin
    • NFT News
  • DeFi
  • Blockchain
  • Regulation
  • Shop
  • Blog
  • Calculator
No Result
View All Result
  • Home
  • Live Crypto Prices
  • Crypto News
    • Bitcoin
    • Ethereum
    • Ripple
    • Altcoin
    • NFT News
  • DeFi
  • Blockchain
  • Regulation
  • Shop
  • Blog
  • Calculator
No Result
View All Result
CryptoBangs.com
No Result
View All Result

Historical Bitcoin Fractal Pattern Hints At Crash Below $20,000

October 4, 2023
in Bitcoin
Reading Time: 4 mins read
A A
Historical Bitcoin Fractal Pattern Hints At Crash Below $20,000
ShareShareShareShareShare

Related articles

Tucker Carlson and Roger Ver Reveal Shocking Details About US Extradition Battle and Bitcoin in Exclusive TCN Interview

Tucker Carlson and Roger Ver Reveal Shocking Details About US Extradition Battle and Bitcoin in Exclusive TCN Interview

December 10, 2024
Former US Treasury Secretary Calls Trump’s National Bitcoin Reserve Proposal ‘Crazy’

Former US Treasury Secretary Calls Trump’s National Bitcoin Reserve Proposal ‘Crazy’

December 10, 2024

A detailed analysis by well-regarded crypto analyst Rekt Capital has spotlighted a recurring bearish fractal in the historical price data of Bitcoin, raising prospects of a potential crash below the $20,000 mark. Notoriously seen in 2019 and 2022, this pattern seems to be reemerging in the current 2023 market.

For those unfamiliar, the fractal indicator identifies potential turning points on a price chart by highlighting repetitive price patterns. In simple terms, a bearish fractal suggests a potential decline in price. Such a pattern materializes when there’s a peak price with two consecutively lower high bars/candles on its flanks. An up arrow typically marks a bearish fractal, indicating the potential for price descent.

Here’s Why Bitcoin Price Could Drop Below $20,000

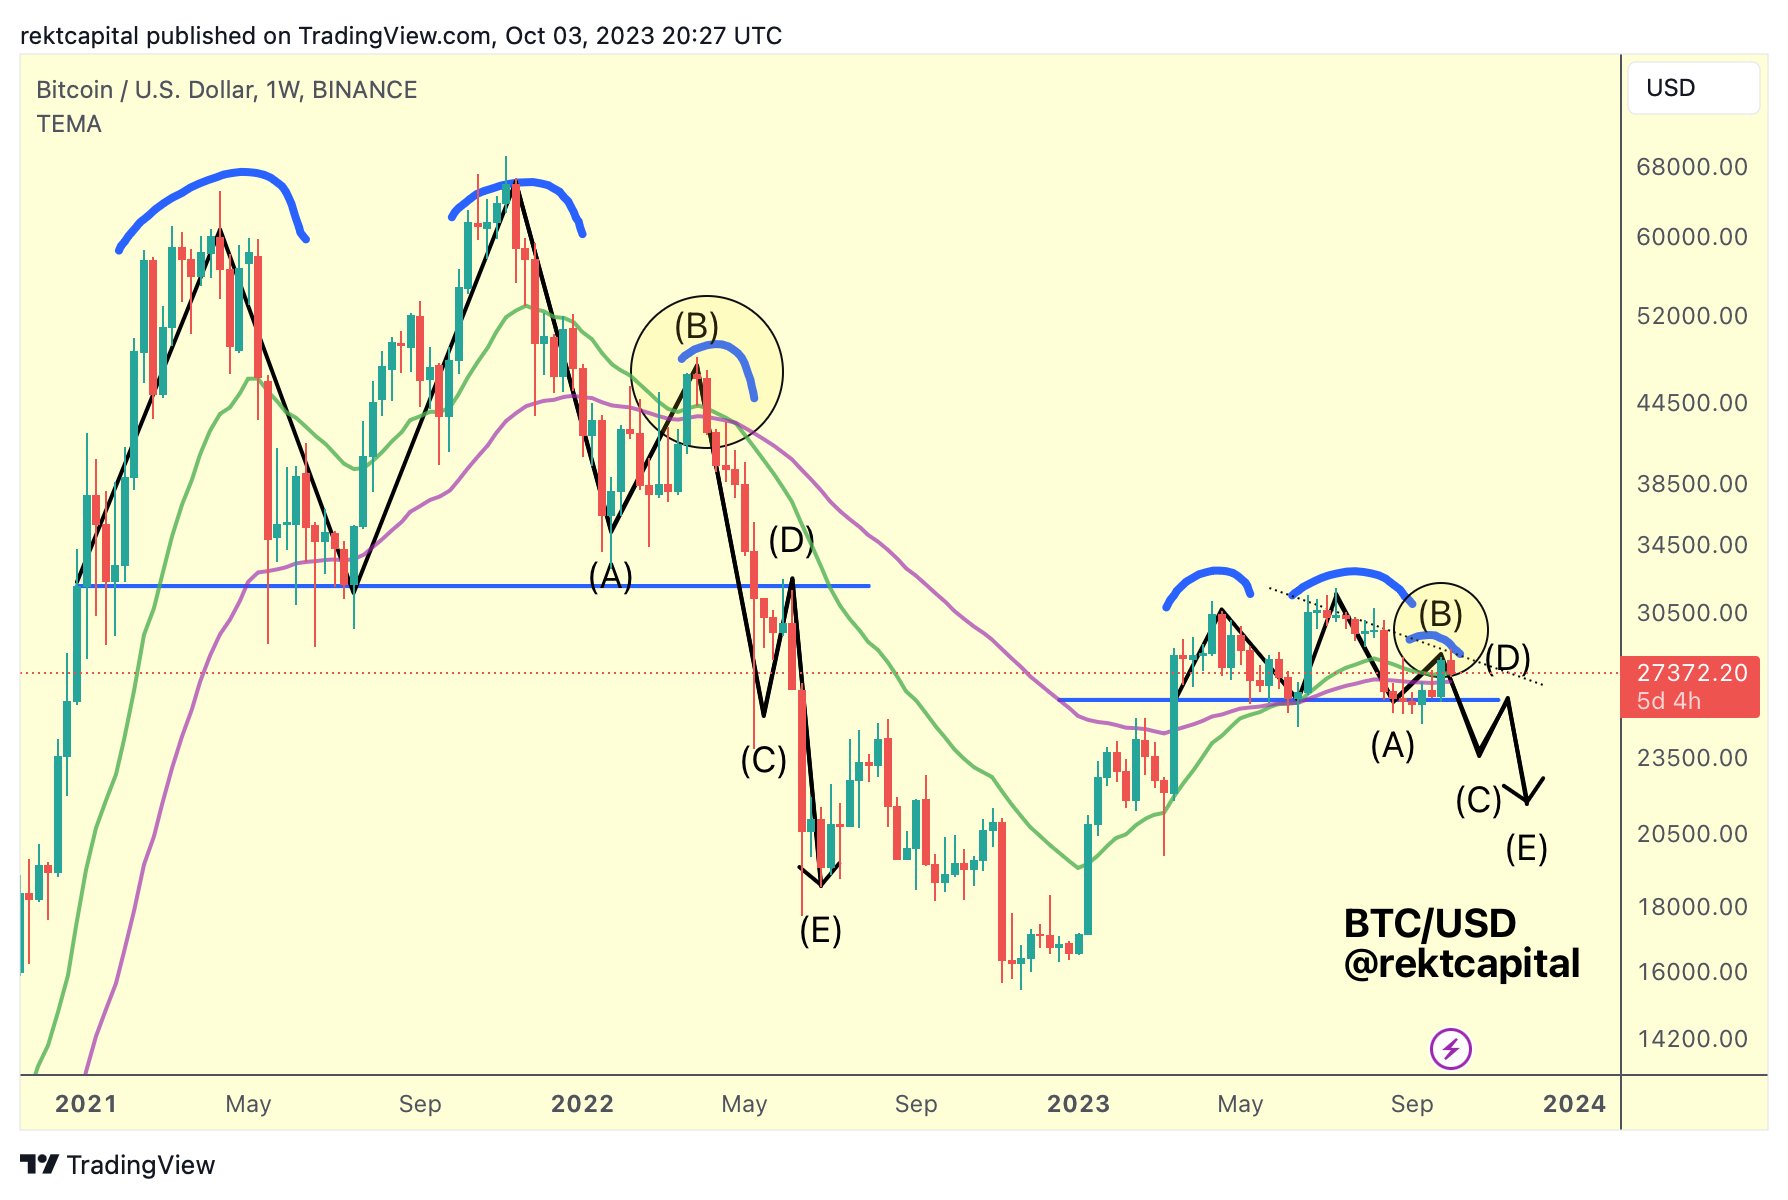
The essence of this bearish pattern begins with a double top. Contrary to expectations, this double top doesn’t validate with a dip below a significant support level. Instead, the price typically sees a relief rally, forming a lower high, only to crash below the previously mentioned support.

This support then morphs into a new resistance level, driving the price further down. This sequence was observed in both 2019 and 2022, and the current market scenario in 2023 mirrors the initial stages of this pattern. Rekt Capital suggests that the market is potentially in the middle of this bearish fractal, with uncertainty around where the relief rally might conclude.

From the beginning of April to the end of August, BTC formed a double-top pattern in the weekly chart. However, the Bitcoin price held above the neckline at around $26,000. Then, in mid-August, BTC started its relief rally which took the price up to $28,600. “We’re probably in the A to B [phase of the] bearish fractal,” the analyst added.

Bitcoin bearish fractal | Source: X @rektcapital

Diving deeper into potential scenarios, the analyst believes Bitcoin’s price could rally up to approximately $29,000 before experiencing further declines. Some key events to watch for include potential overextensions beyond the bull market support band. If Bitcoin fails to retest and maintain this band as support after breaking out, the bearish fractal remains valid.

Another important point to monitor is the revisit of the lower high resistance. Even if the price wicks beyond this resistance, a subsequent rejection would keep the bearish outlook intact. There are, however, criteria that could invalidate this bearish perspective: the bull market support band (blue) consistently holds as support, a weekly close beyond the lower high resistance ($28,000), and breaking past the $31,000 yearly highs.

Lower High is also confluent resistance with the 200-week MA
The lower high is confluent with resistance at the 200-week MA | Source: X @rektcapital

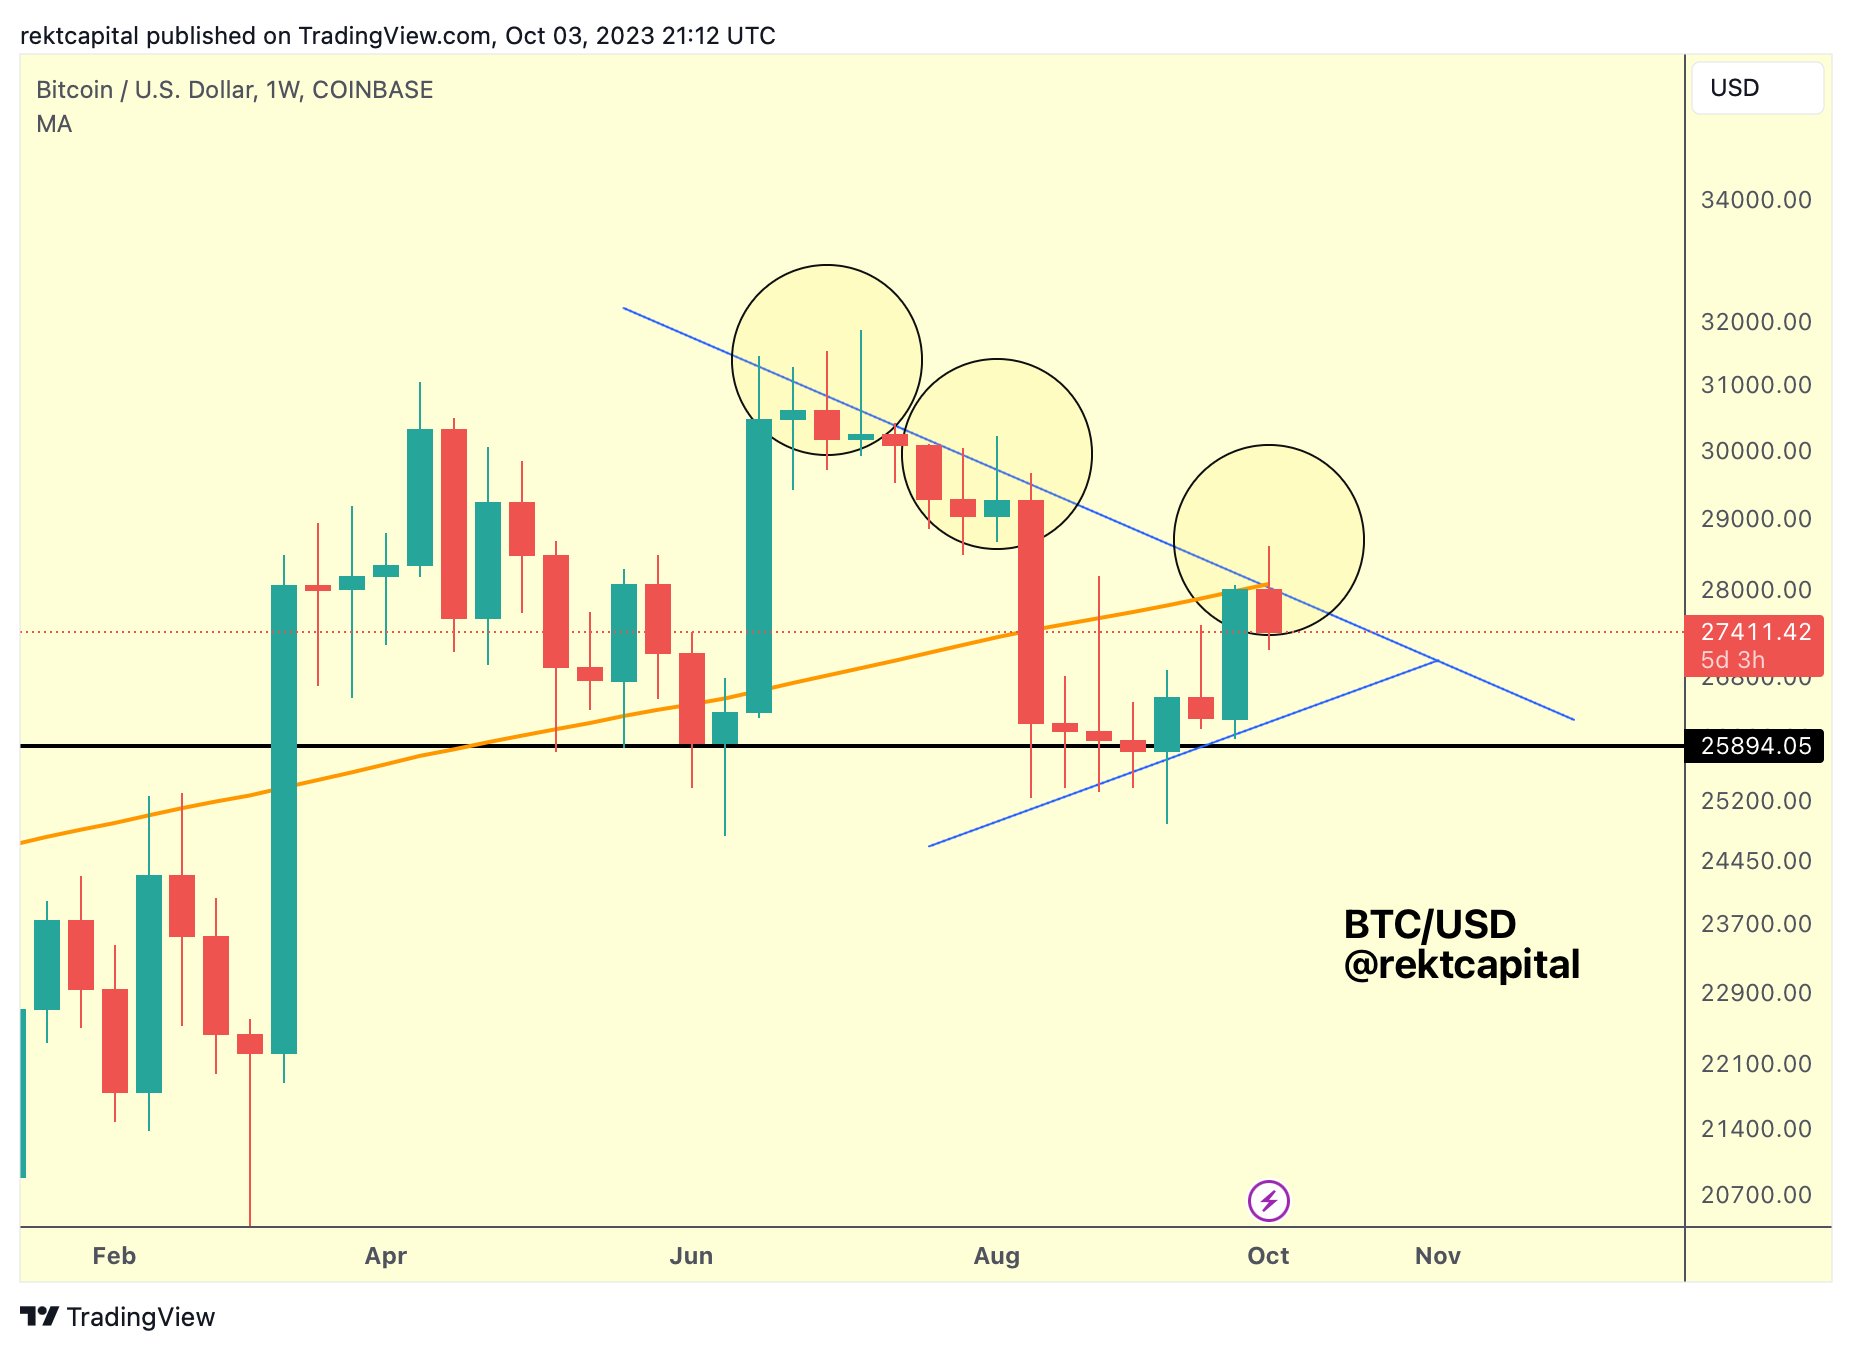
On the topic of other technical indicators, Rekt Capital highlighted that Bitcoin has recently rallied to the 200-week MA. This moving average (MA), however, seems to be acting as a current resistance. Additionally, the 200-week MA aligns with the lower high resistance, presenting a crucial juncture for Bitcoin’s price in the near future. Despite his macro bullish stance on Bitcoin, Rekt Capital cautions that Bitcoin has yet to overcome the $28,000 lower high resistance in the 1-week chart.

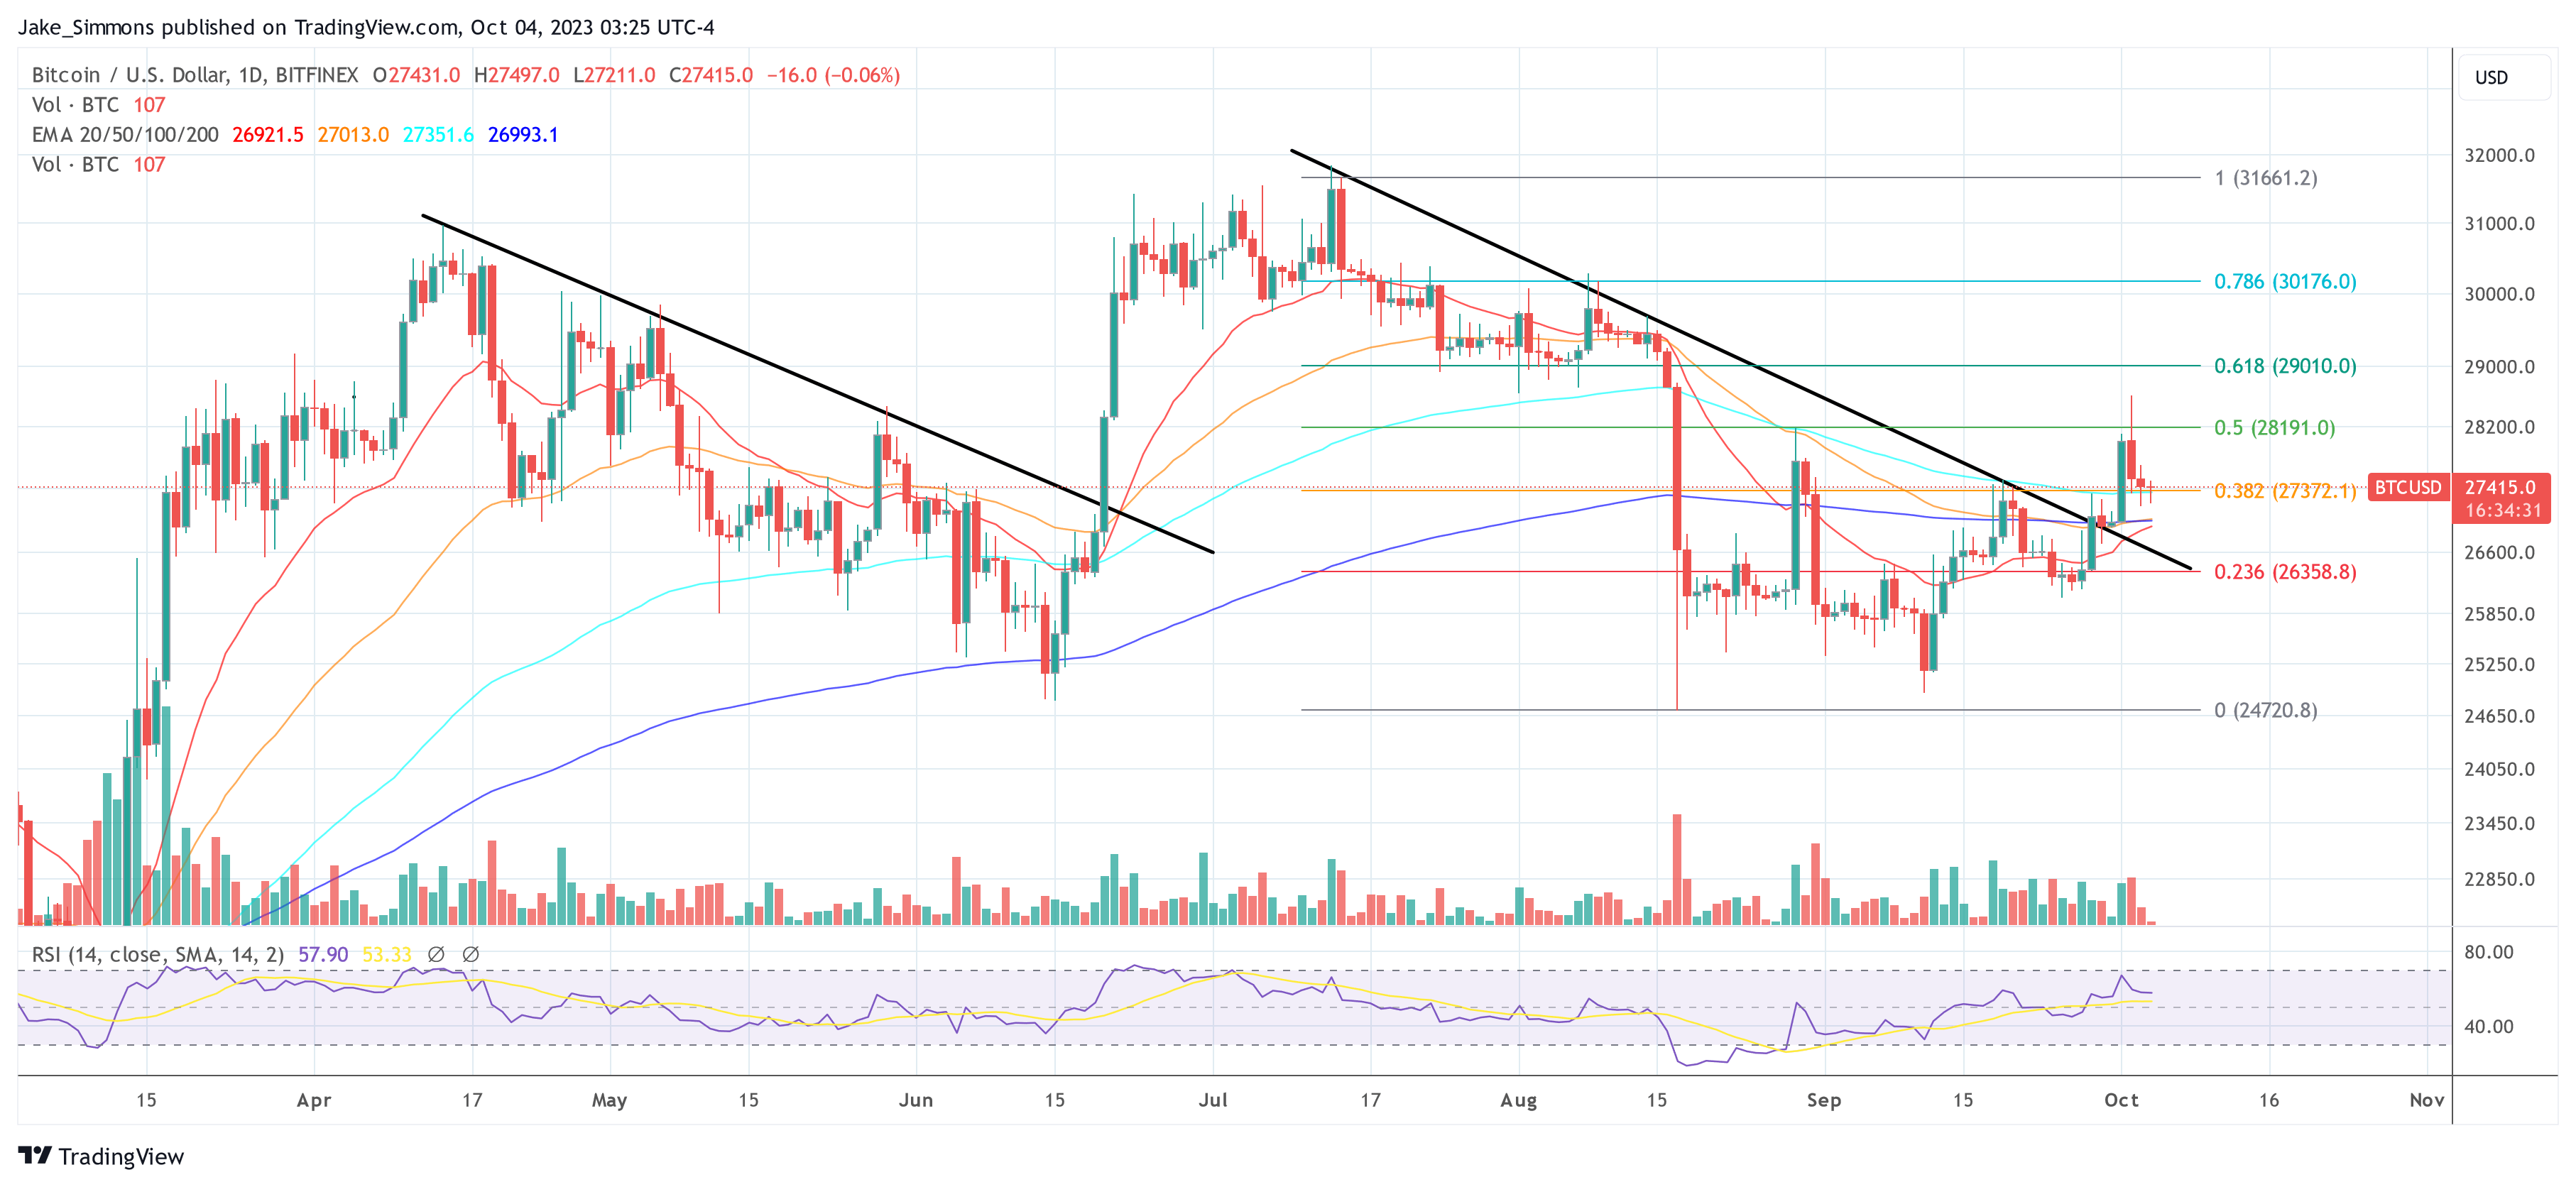
On the daily chart, Bitcoin is hovering slightly above the 38.2% Fibonacci retracement mark. For Bitcoin to avoid a descent beneath the established trend line (represented in black), it’s crucial for it to maintain a position above $27,372.

Bitcoin price
BTC hovers above key support, 1-day chart | Source: BTCUSD on TradingView.com

Featured image from Shutterstock, chart from TradingView.com


Credit: Source link

ShareTweetSendPinShare
Previous Post

Sygnum Singapore Secures MPI License from MAS

Next Post

Vitalik considers implications of adding ZK-EVM, other features to Ethereum mainnet

Related Posts

Tucker Carlson and Roger Ver Reveal Shocking Details About US Extradition Battle and Bitcoin in Exclusive TCN Interview

Tucker Carlson and Roger Ver Reveal Shocking Details About US Extradition Battle and Bitcoin in Exclusive TCN Interview

December 10, 2024

In a recent interview on the Tucker Carlson Network, Tucker Carlson explored Roger Ver’s perspective on his ongoing legal battle...

Former US Treasury Secretary Calls Trump’s National Bitcoin Reserve Proposal ‘Crazy’

Former US Treasury Secretary Calls Trump’s National Bitcoin Reserve Proposal ‘Crazy’

December 10, 2024

President-elect Donald Trump’s proposal to establish a national Bitcoin reserve has ignited a wave of criticism from economic experts, including...

Almost $10 Billion Invested In US Bitcoin ETFs

Almost $10 Billion Invested In US Bitcoin ETFs

December 10, 2024

Este artículo también está disponible en español. Since Donald Trump became president-elect a little more than a month ago, roughly...

BRICS Retaliation Ahead? Expert Predicts US Tariff Fallout

BRICS Retaliation Ahead? Expert Predicts US Tariff Fallout

December 10, 2024

BRICS nations brace for a global economic standoff as U.S. tariff threats spark concerns about trade retaliation and geopolitical tensions,...

Crypto Fund Flows Hit $3.85 Billion Weekly Record As Bitcoin And Ethereum Dominate

Crypto Fund Flows Hit $3.85 Billion Weekly Record As Bitcoin And Ethereum Dominate

December 9, 2024

According to the latest report by CoinShares, crypto asset investment products have achieved a historic milestone, with weekly inflows totaling...

Load More
Next Post
Vitalik considers implications of adding ZK-EVM, other features to Ethereum mainnet

Vitalik considers implications of adding ZK-EVM, other features to Ethereum mainnet

No Content Available
CryptoBangs.com

CryptoBangs.com is an online news portal that aims to share the latest crypto news, bitcoin, altcoin, blockchain, nft news and much more stuff like that.

What’s New Here!

  • Tucker Carlson and Roger Ver Reveal Shocking Details About US Extradition Battle and Bitcoin in Exclusive TCN Interview
  • Goldman Sachs eyeing crypto market-making for Bitcoin, Ethereum if US regulations shift
  • BC.GAME Announces UFC Welterweight Champion Colby Covington as New Brand Ambassador
  • How High Will Dogecoin Rise If the Markets ‘Go Wild’?

Newsletter

Don't miss a beat and stay up to date with our Newsletter!
Loading

  • Contact Us
  • Privacy Policy
  • Terms of Use
  • DMCA
  • Disclaimer

© 2023 - CryptoBangs.com - All Rights Reserved!

No Result
View All Result
  • Home
  • Live Crypto Prices
  • Crypto News
    • Bitcoin
    • Ethereum
    • Ripple
    • Altcoin
    • NFT News
  • DeFi
  • Blockchain
  • Regulation
  • Shop
  • Blog
  • Calculator

© 2018 JNews by Jegtheme.

Please enter CoinGecko Free Api Key to get this plugin works.
WP Twitter Auto Publish Powered By : XYZScripts.com