• Contact Us
  • Privacy Policy
  • Terms of Use
  • DMCA
  • Disclaimer
Sunday, December 21, 2025
CryptoBangs.com
Advertisement
  • Home
  • Live Crypto Prices
  • Crypto News
    • Bitcoin
    • Ethereum
    • Ripple
    • Altcoin
    • NFT News
  • DeFi
  • Blockchain
  • Regulation
  • Shop
  • Blog
  • Calculator
No Result
View All Result
  • Home
  • Live Crypto Prices
  • Crypto News
    • Bitcoin
    • Ethereum
    • Ripple
    • Altcoin
    • NFT News
  • DeFi
  • Blockchain
  • Regulation
  • Shop
  • Blog
  • Calculator
No Result
View All Result
CryptoBangs.com
No Result
View All Result

Metrics indicate bullish sentiment as illiquid Bitcoin supply reaches 80%

January 22, 2023
in Altcoin
Reading Time: 4 mins read
A A
Metrics indicate bullish sentiment as illiquid Bitcoin supply reaches 80%
ShareShareShareShareShare

Related articles

How Much Could It Grow by 2030?

How Much Could It Grow by 2030?

December 10, 2024
Dogecoin Predicted To Hit $3: Here’s When

Dogecoin Predicted To Hit $3: Here’s When

December 10, 2024

CryptoSlate analysis of Bitcoin (BTC) metrics reveals that the market bottom may have been reached as investors continue accumulating BTC and pushing illiquid supply up to 80%.

Analysts reviewed metrics, including the MVRV-Z and Realized Price metrics, to discover both indicate bullish sentiments.

MVRV-Z metric

The MVRV-Z score is used to assess whether BTC is over or under-valued. When the market value is significantly higher than BTC’s “fair value,” the metric stays in the red zone. On the other hand, if the price is lower than BTC’s realized value, the metric lingers around in the green area. The chart below represents the MVRV-Z metric with the orange line.

BTC MVRV-Z since 2010

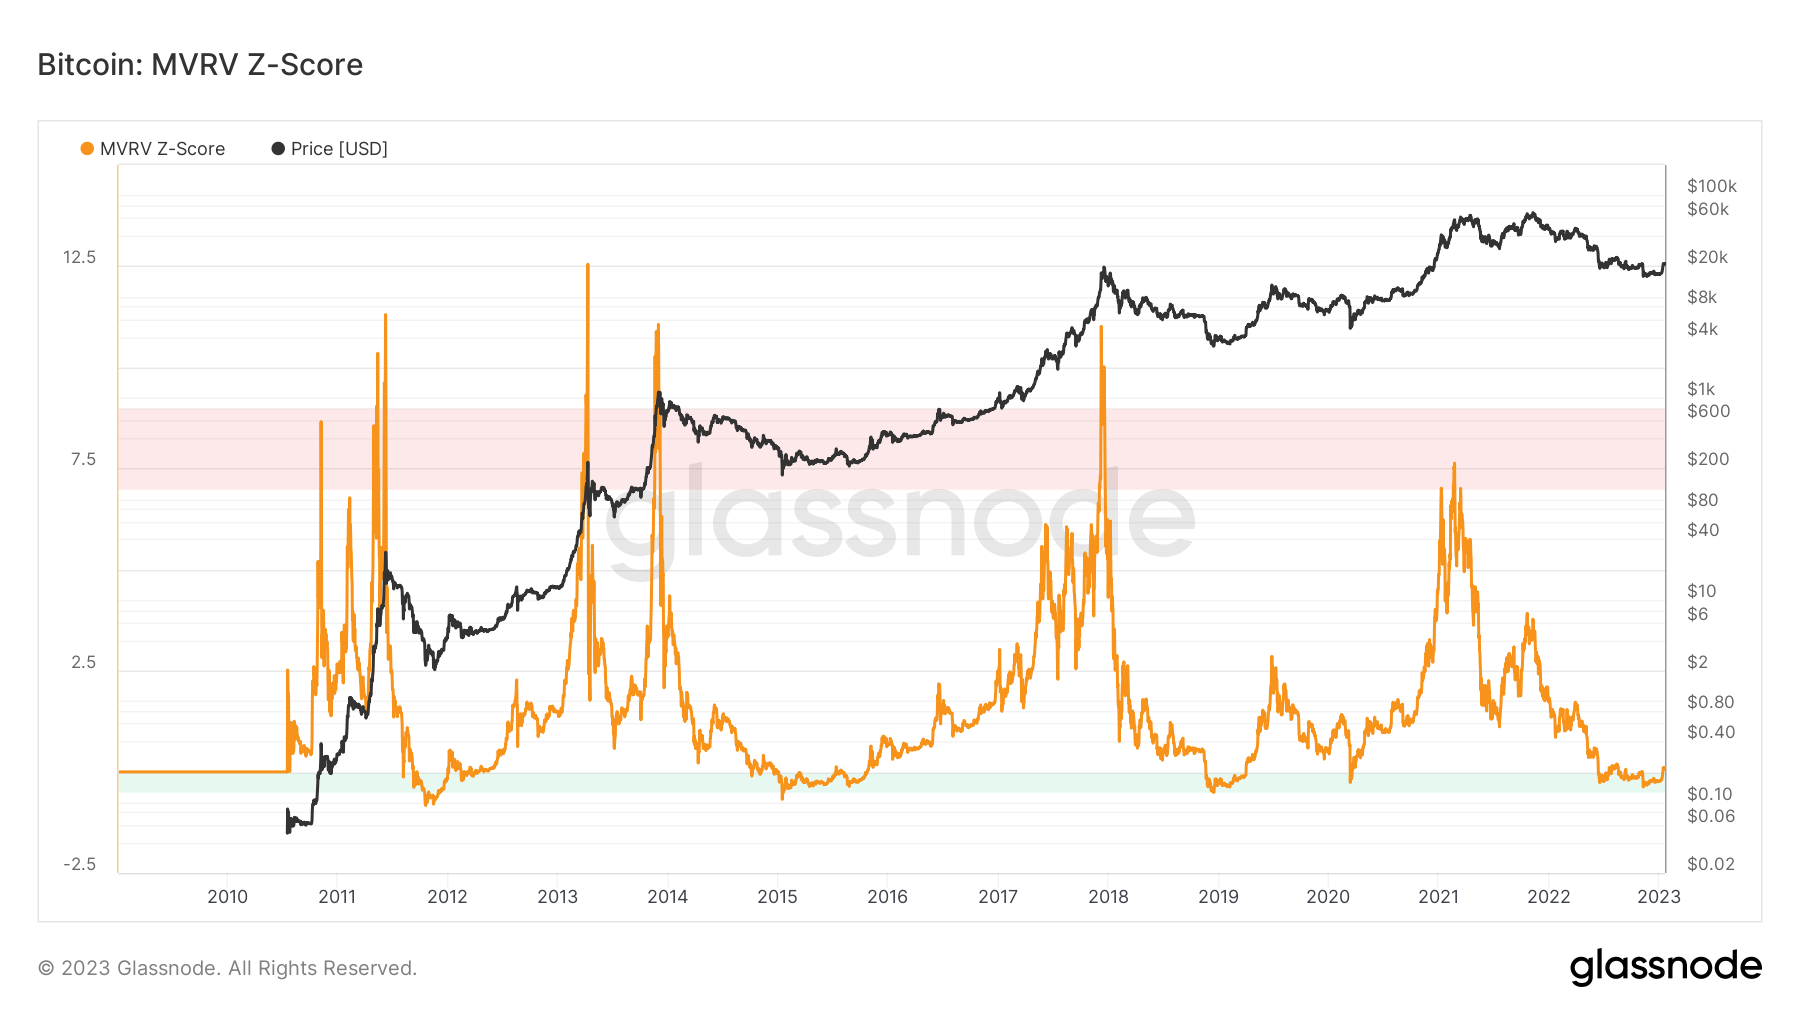
The metric entered the green zone in mid-2022, right after the LUNA collapse, and has been moving within the green area since then. It only broke through very recently, which might signal that the market bottom has been reached.

Historically, Bitcoin’s price has significantly decreased whenever the MVRV-Z metric reached the red zone. According to the chart, this correlation has been visible six times since 2010. Therefore, it is possible to conclude that the MVRV-Z metric indicates a market top if it is in the red zone.

Similarly, historical evidence also shows that Bitcoin’s price increases after the metric reaches the green zone, indicating a market bottom. The price movements recorded in early 2012, 2015, 2019, and 2020 correspond to market bottoms.

BTC realized price

The realized price is calculated by dividing the realized cap by the current supply. The metric signifies a bear market when the actual price falls below the realized price. Conversely, if the real price increases above the realized price, it indicates a bull market.

BTC realized price since 2010
BTC realized its price since 2010

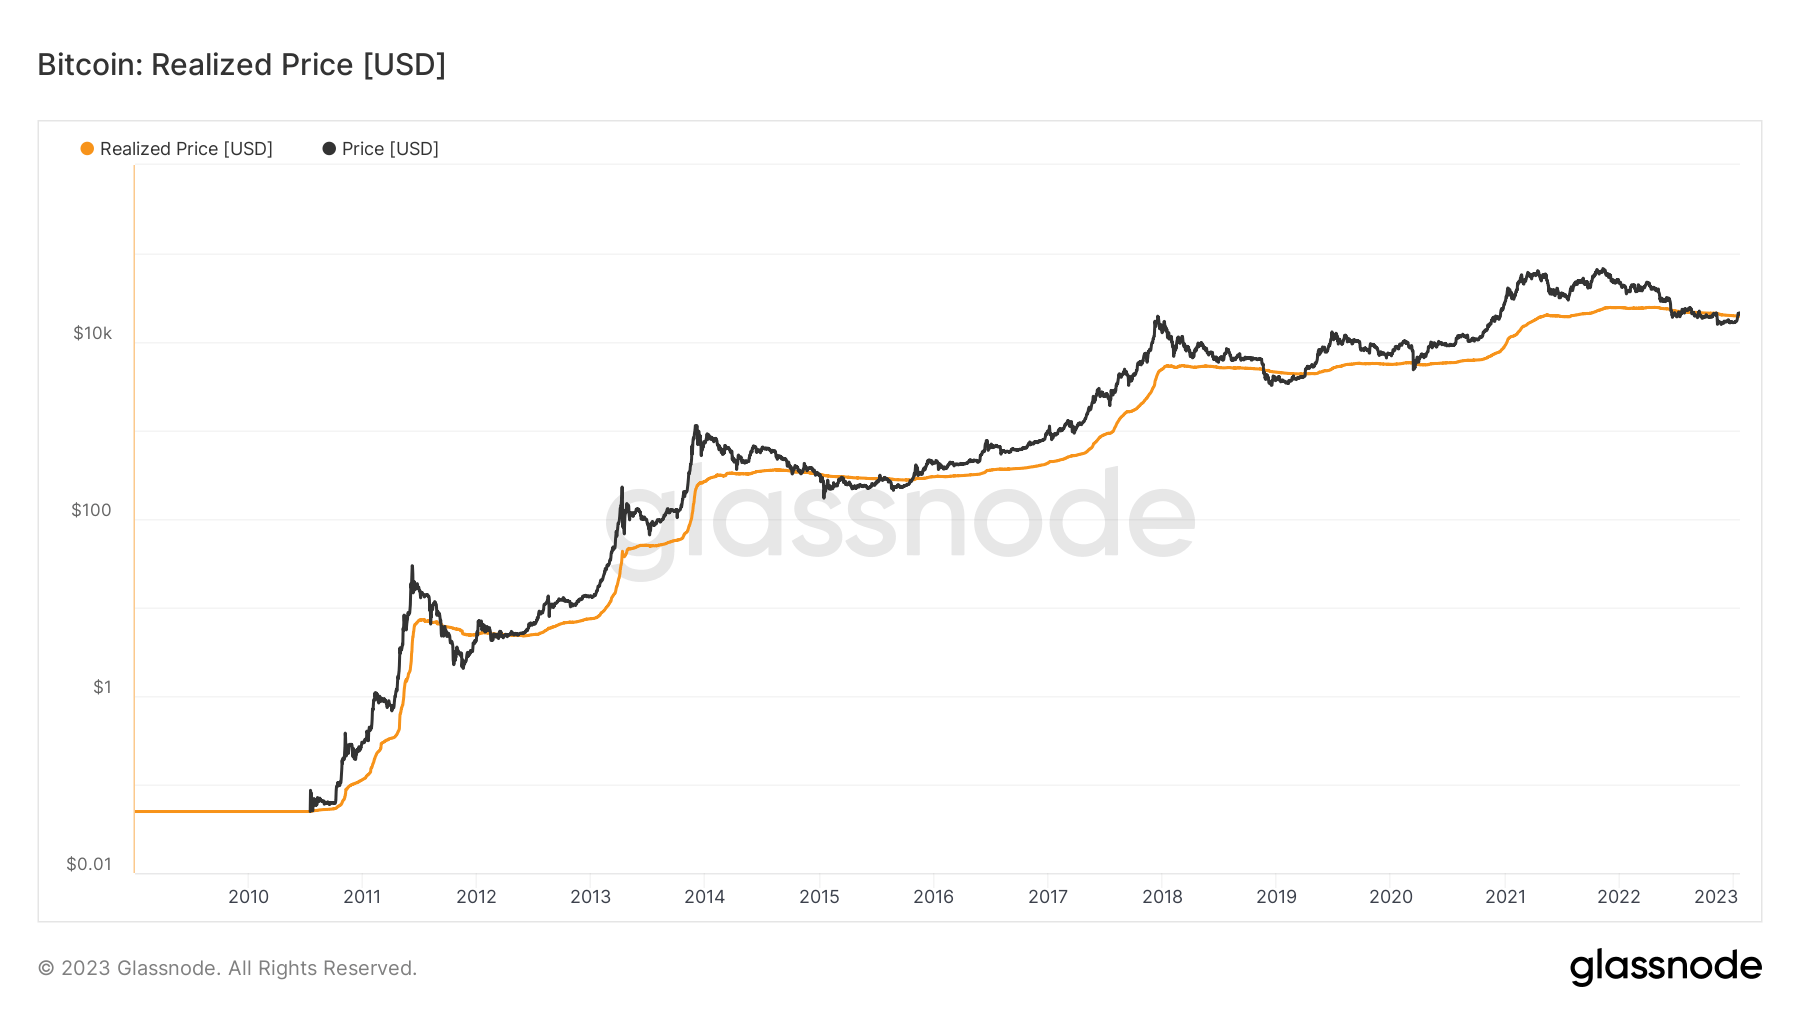
The chart above represents the relationship between BTC’s realized price and actual price since 2010. The real BTC price has been below the realized price since mid-2022. However, this balance changed very recently as the actual price surpassed the realized price, which indicates a bull market sentiment.

80% of BTC is illiquid

Investors have been accumulating BTC over the past few months. However, cCyptoSlate analysis from Dec. 13, 2022, revealed that the amount of BTC that sat on exchanges had hit its all-time low since 2018.

The withdrawals have also been in large chunks, and at the end of November, over $2 billion worth of BTC was withdrawn from Coinbase. On Dec. 23, Binance lost 90,000 BTC from its reserves in a week. Another $120 million worth of Bitcoin was withdrawn from different exchanges during the first ten days of 2023.

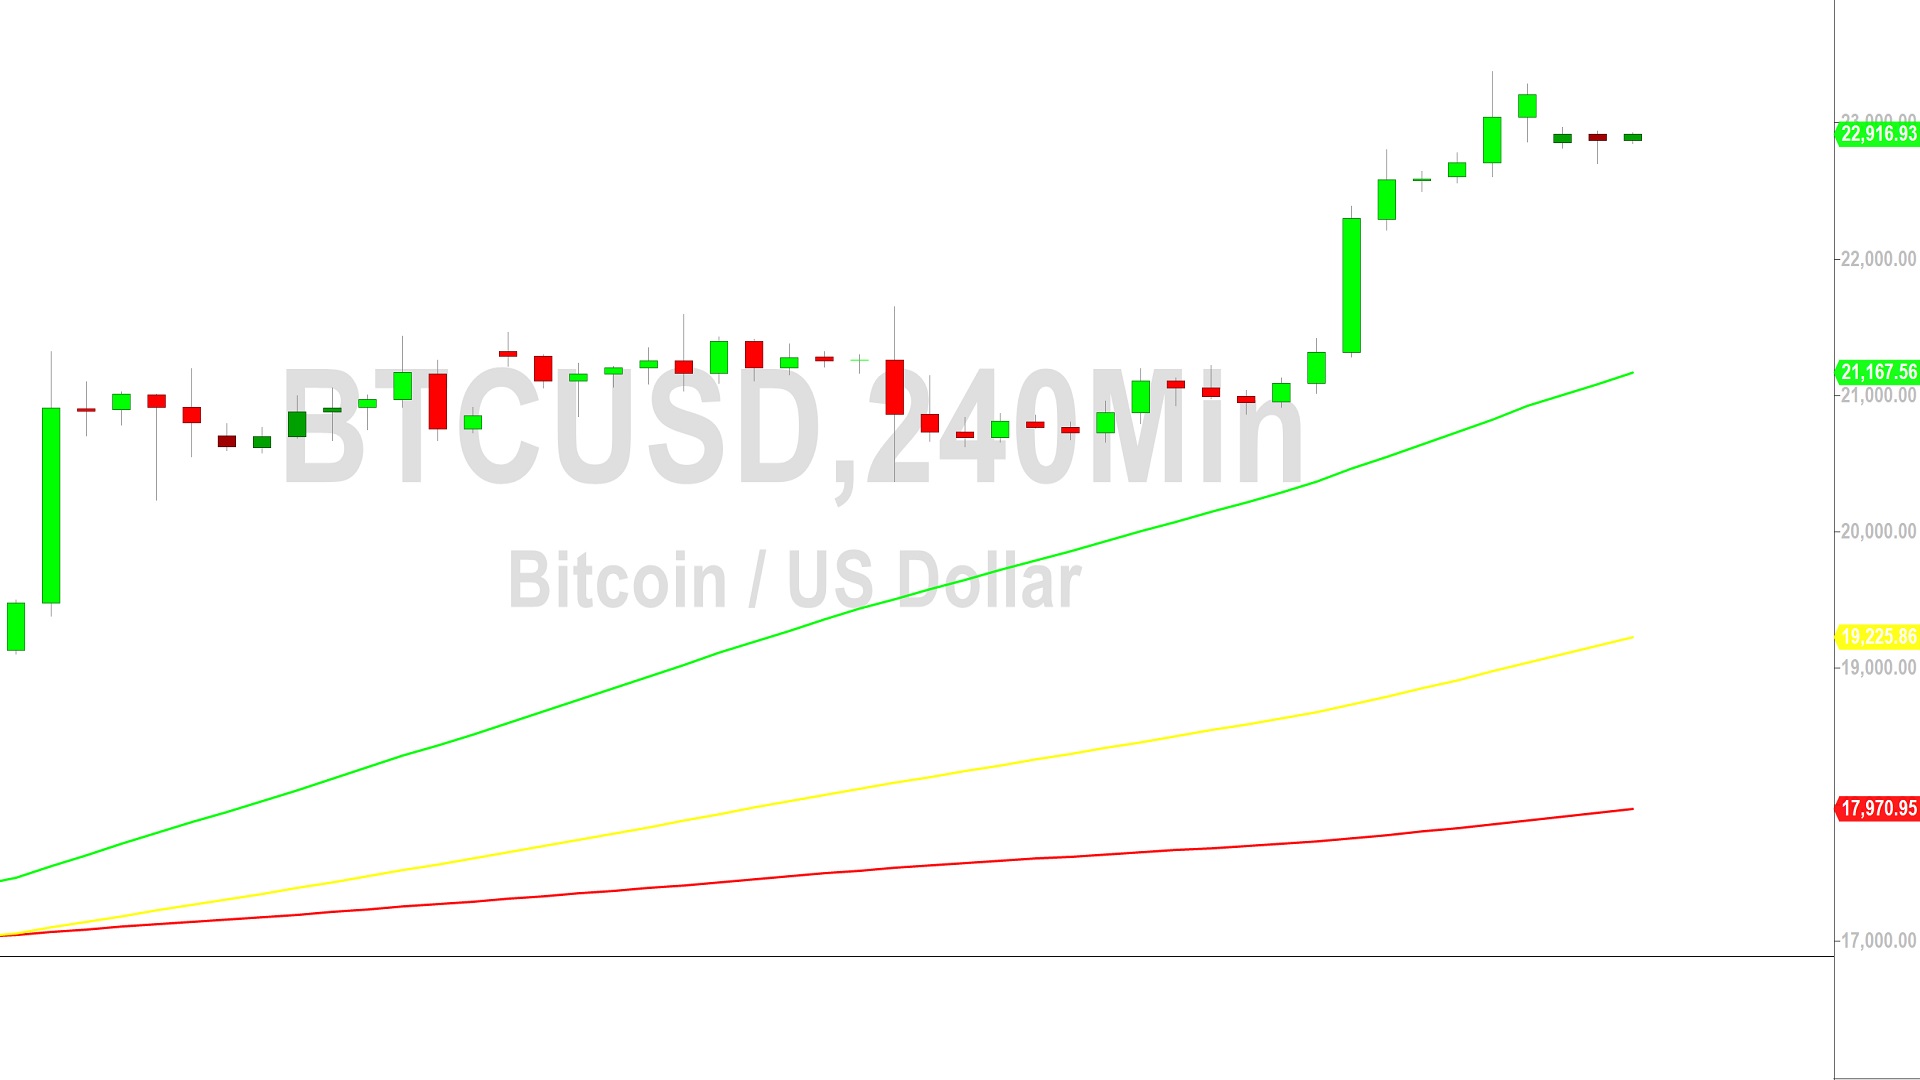
The current metrics have been signaling a BTC bottom since Jan. 19. On Jan. 21, BTC broke through the $23,000 level, recording a 50% increase since its bear-market low of $15,400. However, the upwards price movements didn’t stop the BTC withdrawals. A0,000 BTC was withdrawn from exchanges on Jan. 20, with the majority being pulled out from Binance.

Data also indicates that a large amount of withdrawn BTC is being sent to cold storage. For example, 450,000 BTC held on hot wallets or exchanges were moved to cold storage in 2022.

Another 110,000 BTC has been sent to cold storage so far in 2023. With this, the amount of illiquid BTC held in cold wallets reached an all-time high of 15.1 million coins. This amount accounts for 80% of the total circulating supply of BTC.

BTC illiquid supply
BTC illiquid supply

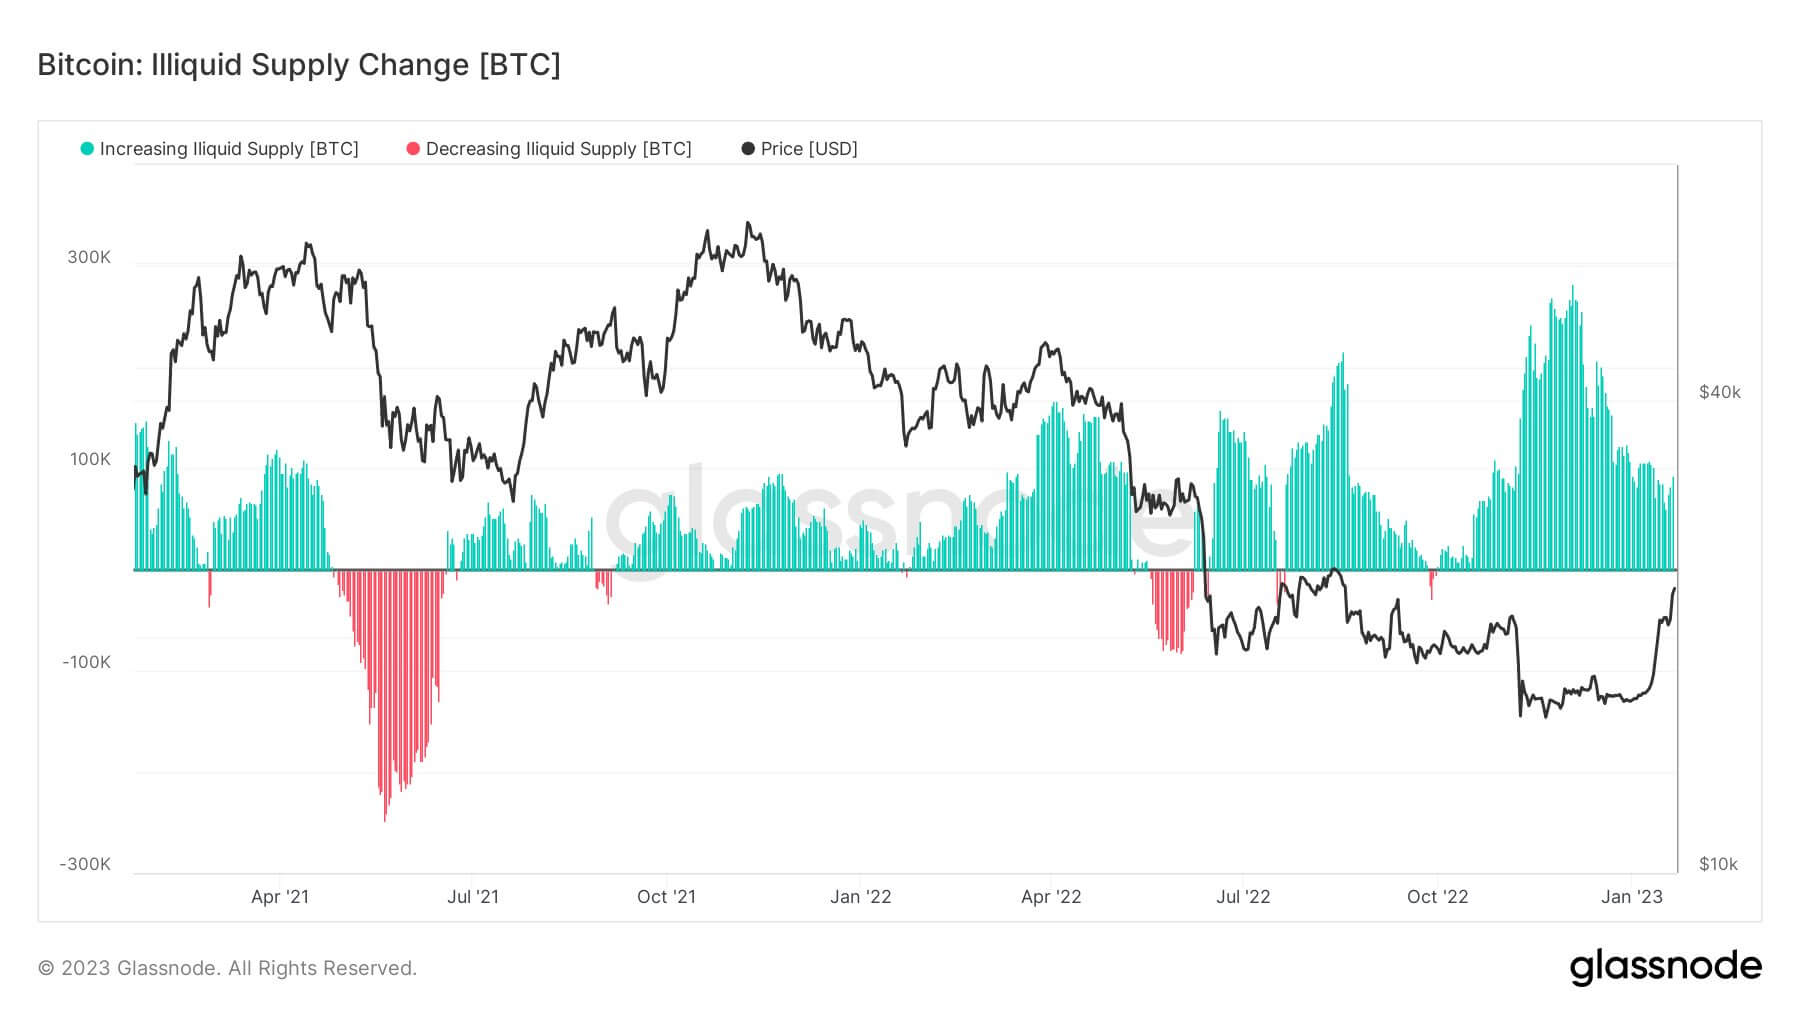
The chart above represents the illiquid BTC supply with the green zones while showing the liquid supply with the red. The BTC accumulations have significantly increased the illiquid supply since July 2022, except for brief periods during July and October.

Credit: Source link

ShareTweetSendPinShare
Previous Post

A look at what’s going on with Bitzlato and its impact

Next Post

Bitcoin Price Analysis: Minor Ground Ceded

Related Posts

How Much Could It Grow by 2030?

How Much Could It Grow by 2030?

December 10, 2024

The entire cryptocurrency market took a huge hit after its recent rally. As Bitcoin (BTC) plummeted below the $100,000 mark,...

Dogecoin Predicted To Hit $3: Here’s When

Dogecoin Predicted To Hit $3: Here’s When

December 10, 2024

The cryptocurrency market has faced a significant correction in the last 24 hours. Bitcoin (BTC) has fallen to the mid-$96,000...

Trader Turns $3,000 Into $73 Million

Trader Turns $3,000 Into $73 Million

December 10, 2024

Pepe (PEPE) has had an incredible year so far. The Solana-based memecoin has made waves within the cryptocurrency community. The...

How High Will DOGE Trade Around Christmas?

How High Will DOGE Trade Around Christmas?

December 10, 2024

Dogecoin is one of the most trending tokens in the current cryptocurrency market, attracting significant volume and attention recently. Its...

LINK Eyes $50 Price Breakthrough

LINK Eyes $50 Price Breakthrough

December 9, 2024

Chainlink (LINK) continues to outshine the top 10 crypto projects by market cap, despite sitting at 14th on the rankings....

Load More
Next Post
Bitcoin Price Analysis: Minor Ground Ceded

Bitcoin Price Analysis: Minor Ground Ceded

No Content Available
CryptoBangs.com

CryptoBangs.com is an online news portal that aims to share the latest crypto news, bitcoin, altcoin, blockchain, nft news and much more stuff like that.

What’s New Here!

  • Tucker Carlson and Roger Ver Reveal Shocking Details About US Extradition Battle and Bitcoin in Exclusive TCN Interview
  • Goldman Sachs eyeing crypto market-making for Bitcoin, Ethereum if US regulations shift
  • BC.GAME Announces UFC Welterweight Champion Colby Covington as New Brand Ambassador
  • How High Will Dogecoin Rise If the Markets ‘Go Wild’?

Newsletter

Don't miss a beat and stay up to date with our Newsletter!
Loading

  • Contact Us
  • Privacy Policy
  • Terms of Use
  • DMCA
  • Disclaimer

© 2023 - CryptoBangs.com - All Rights Reserved!

No Result
View All Result
  • Home
  • Live Crypto Prices
  • Crypto News
    • Bitcoin
    • Ethereum
    • Ripple
    • Altcoin
    • NFT News
  • DeFi
  • Blockchain
  • Regulation
  • Shop
  • Blog
  • Calculator

© 2018 JNews by Jegtheme.

Please enter CoinGecko Free Api Key to get this plugin works.
WP Twitter Auto Publish Powered By : XYZScripts.com