• Contact Us
  • Privacy Policy
  • Terms of Use
  • DMCA
  • Disclaimer
Tuesday, December 23, 2025
CryptoBangs.com
Advertisement
  • Home
  • Live Crypto Prices
  • Crypto News
    • Bitcoin
    • Ethereum
    • Ripple
    • Altcoin
    • NFT News
  • DeFi
  • Blockchain
  • Regulation
  • Shop
  • Blog
  • Calculator
No Result
View All Result
  • Home
  • Live Crypto Prices
  • Crypto News
    • Bitcoin
    • Ethereum
    • Ripple
    • Altcoin
    • NFT News
  • DeFi
  • Blockchain
  • Regulation
  • Shop
  • Blog
  • Calculator
No Result
View All Result
CryptoBangs.com
No Result
View All Result

Solana Drops Below 100-Day MA On 4-Hour Chart, SOL Price In Danger?

February 24, 2024
in Bitcoin
Reading Time: 3 mins read
A A
Solana Drops Below 100-Day MA On 4-Hour Chart, SOL Price In Danger?
ShareShareShareShareShare

Having failed to break its previous high for the year, the price of Solana has continued to move downward. From the height of $118.88, the coin, which is currently ranked 5th in the crypto space with a total supply of 440,961,455 SOL and a market capitalization of $58.2 million,  has made a drop of over 25% and is not showing any signs of stopping.

As of the time of writing, the price of SOL was up by 2.76% and trading around $102.63, below the 100-day moving average in the last 24 hours. Meanwhile, in the daily timeframe, the price has dropped a bearish candlestick, indicating that the price is still bearish.

The moving average indicator generally is used to determine the trend of an asset, which could be an uptrend or downtrend. Since the price of Solana is trading below the 100-day moving average, could this mean that the price has changed from an uptrend to a downtrend?

Solana On The 4-Hour Chart

A technical examination of the chart from the 4-hour timeframe and with the help of a trend line we can see that two resistance levels of $118.88 and $114.87 have been created by previous price movement. We can also see that the price has broken the support level of $103.57. Therefore, the price for the next destination might be the $92.84 support level. 

This can be seen in the image below:

Source: Tradingview.com

Also, taking a look at the 4-hour timeframe chart with the help of the MACD indicator in the above image, we can see that the MACD histogram is trending below the MACD zero line. Both the MACD line and the signal line have crossed and are trending below the MACD zero line, suggesting that the price of SOL is bearish and could continue to move downward.

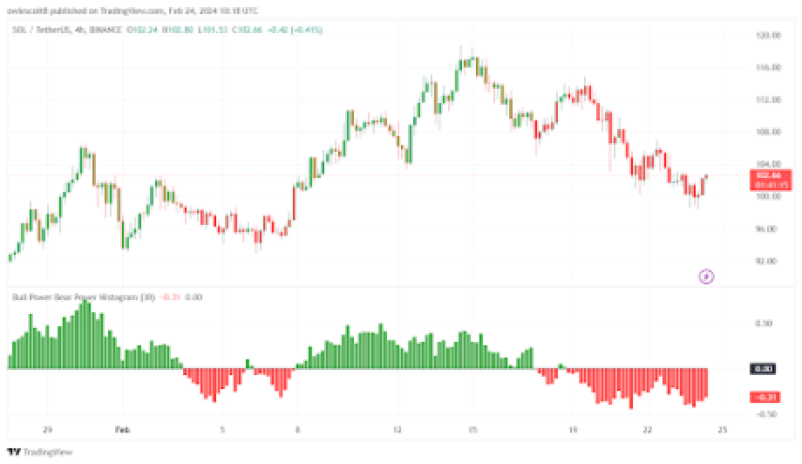
A final look at the chart with the help of the Bull Power Vs. Bear Power Histogram indicator, we can see that the histograms are trending below the zero line. This suggests that buyers have completely lost momentum in the market, and sellers have taken over it. Thus, the price will tend to move downward. 

Related articles

Tucker Carlson and Roger Ver Reveal Shocking Details About US Extradition Battle and Bitcoin in Exclusive TCN Interview

Tucker Carlson and Roger Ver Reveal Shocking Details About US Extradition Battle and Bitcoin in Exclusive TCN Interview

December 10, 2024
Former US Treasury Secretary Calls Trump’s National Bitcoin Reserve Proposal ‘Crazy’

Former US Treasury Secretary Calls Trump’s National Bitcoin Reserve Proposal ‘Crazy’

December 10, 2024

We can see this in the image below:

SOL price

Source: Tradingview.com

Possible Outcomes If The SOL Price Continues To Drop

If SOL continues to drop, we might see the price moving toward the support level of $92.84. Also, if it manages to break below this level, the price might move further downward toward the $79.32 support level.

Presently, Solana is seeing minor upsides of 1.3% in the last 24 hours, according to data from CoinMarketCap.

Solana price chart from Tradingview.com (SOL price)

SOL bulls struggle to maintain price at $102 | Source: SOLUSD on Tradingview.com

Featured image from Coinfomania, charts from Tradingview.com

Disclaimer: The article is provided for educational purposes only. It does not represent the opinions of NewsBTC on whether to buy, sell or hold any investments and naturally investing carries risks. You are advised to conduct your own research before making any investment decisions. Use information provided on this website entirely at your own risk.

Credit: Source link

ShareTweetSendPinShare
Previous Post

Ripple XRP to Finally Soar to $1.40? Here’s What Analysts Think

Next Post

The Graph Crypto Price Prediction – Evaluating $GRT Tokenomics and Market Insights

Related Posts

Tucker Carlson and Roger Ver Reveal Shocking Details About US Extradition Battle and Bitcoin in Exclusive TCN Interview

Tucker Carlson and Roger Ver Reveal Shocking Details About US Extradition Battle and Bitcoin in Exclusive TCN Interview

December 10, 2024

In a recent interview on the Tucker Carlson Network, Tucker Carlson explored Roger Ver’s perspective on his ongoing legal battle...

Former US Treasury Secretary Calls Trump’s National Bitcoin Reserve Proposal ‘Crazy’

Former US Treasury Secretary Calls Trump’s National Bitcoin Reserve Proposal ‘Crazy’

December 10, 2024

President-elect Donald Trump’s proposal to establish a national Bitcoin reserve has ignited a wave of criticism from economic experts, including...

Almost $10 Billion Invested In US Bitcoin ETFs

Almost $10 Billion Invested In US Bitcoin ETFs

December 10, 2024

Este artículo también está disponible en español. Since Donald Trump became president-elect a little more than a month ago, roughly...

BRICS Retaliation Ahead? Expert Predicts US Tariff Fallout

BRICS Retaliation Ahead? Expert Predicts US Tariff Fallout

December 10, 2024

BRICS nations brace for a global economic standoff as U.S. tariff threats spark concerns about trade retaliation and geopolitical tensions,...

Crypto Fund Flows Hit $3.85 Billion Weekly Record As Bitcoin And Ethereum Dominate

Crypto Fund Flows Hit $3.85 Billion Weekly Record As Bitcoin And Ethereum Dominate

December 9, 2024

According to the latest report by CoinShares, crypto asset investment products have achieved a historic milestone, with weekly inflows totaling...

Load More
Next Post
The Graph Crypto Price Prediction – Evaluating $GRT Tokenomics and Market Insights

The Graph Crypto Price Prediction - Evaluating $GRT Tokenomics and Market Insights

No Content Available
CryptoBangs.com

CryptoBangs.com is an online news portal that aims to share the latest crypto news, bitcoin, altcoin, blockchain, nft news and much more stuff like that.

What’s New Here!

  • Tucker Carlson and Roger Ver Reveal Shocking Details About US Extradition Battle and Bitcoin in Exclusive TCN Interview
  • Goldman Sachs eyeing crypto market-making for Bitcoin, Ethereum if US regulations shift
  • BC.GAME Announces UFC Welterweight Champion Colby Covington as New Brand Ambassador
  • How High Will Dogecoin Rise If the Markets ‘Go Wild’?

Newsletter

Don't miss a beat and stay up to date with our Newsletter!
Loading

  • Contact Us
  • Privacy Policy
  • Terms of Use
  • DMCA
  • Disclaimer

© 2023 - CryptoBangs.com - All Rights Reserved!

No Result
View All Result
  • Home
  • Live Crypto Prices
  • Crypto News
    • Bitcoin
    • Ethereum
    • Ripple
    • Altcoin
    • NFT News
  • DeFi
  • Blockchain
  • Regulation
  • Shop
  • Blog
  • Calculator

© 2018 JNews by Jegtheme.

Please enter CoinGecko Free Api Key to get this plugin works.
WP Twitter Auto Publish Powered By : XYZScripts.com